The question
The question: does a small vision-language model, quantized to 4 bits and fine-tuned on one narrow task, do better on that task than prompting the same model, while running on a laptop-class GPU?
The task is food: given one photo of a plate, name the components on it, estimate the mass of each in grams, and estimate total mass, calories, protein, carbohydrates, and fat. A public dataset exists with weighed ground truth for every dish.
Result so far
On a 200-dish validation split held out from the official Nutrition5k training split, QLoRA fine-tuning of Qwen3.5-9B (4-bit, single image, 0.75% of parameters trained) versus the same model zero-shot:
| Zero-shot | Fine-tuned | |
|---|---|---|
| Total mass MAE | 67.9 g | 53.7 g |
| Total mass median APE | 33.4% | 24.5% |
| Calories MAE | 97.4 kcal | 84.5 kcal |
| Component F1 (micro) | 0.124 | 0.505 |
These are validation numbers, not benchmark results. The frozen official test cohorts (n5k_rgb_test_4cam, 600 dishes; n5k_rgb_test_any, 676) have not been run and will be used once. A separate experiment found that prompt optimization (DSPy few-shot demos) helps the base model but adds nothing on top of fine-tuning. Details and caveats follow.
Dataset and evaluation
The dataset is Nutrition5k (Google Research): about 5,000 real dishes, each with per-ingredient masses from a scale, four side-angle videos, an overhead capture, and depth. The local copy is 182 GB. The official split is 4,059 training dishes and 709 test dishes.
Before running any model I wrote the data loader and fixed how results would be scored:
- A Python loader over the release that decodes frames on demand with ffmpeg and never writes to the dataset. Frame sampling is deterministic: indices are the midpoints of
nequal bins, which avoids the first and last frames where hands enter and leave. - Frozen evaluation cohorts with checksums:
n5k_rgb_test_4cam(600 test dishes with all four cameras) andn5k_rgb_test_any(676 test dishes with at least one camera). An5k-manifestcommand builds them;n5k-evalscores predictions against them. - An exact component matcher and a fixed set of metrics (mass MAE and median absolute percentage error, per-nutrient MAE, component precision/recall/F1, and the fraction of ground-truth mass that was matched to a named prediction). The scorer, matcher, and metric weights were fixed before I saw any result.
None of the numbers below are on the frozen test cohorts. Everything so far has used a 200-dish validation split held out from the official training split, so the test cohorts stay untouched until the method is settled.
Contamination audit
Food-R1, a published 8.8B food model, was the obvious outside comparison. Its paper and repository show that its Stage 1 fine-tuning data included a nutrition5k_sft.json file that was never published. There is no way to check which dishes it contains, so none of the 676 dishes in the test cohort can be confirmed clean. I also checked FoodDialogues, the image source Food-R1 points users to, and confirmed its test_id.json matches the official Nutrition5k test split exactly; that is consistent with the split being respected but does not prove it. So Food-R1 is left out as a baseline rather than reported with an asterisk.
General-purpose models (Gemma 4 12B and Gemma 4 26B-A4B) were run only on a 20-dish sanity-check set and are not reported as numbers.
Model and constraints
The base model is Qwen3.5-9B, loaded in 4-bit NF4. Images are capped at 262,144 pixels, which is 252 image tokens per image, and inference uses one frame from camera A, greedy decoding, thinking off. Peak inference VRAM is about 8.2 GB.
Fine-tuning is QLoRA: rank 16, alpha 32, adapters on 248 language-model modules, 43.3M trainable parameters (0.75% of the model), vision tower frozen. Training used 3,337 dishes from the official training split with 200 held out for validation, 2 epochs, learning rate 1e-4. It fits on a laptop RTX 5070 Ti with 11.94 GiB usable at batch size 1, gradient accumulation 16, and gradient checkpointing; 81 training examples over the 1,088-token sequence limit were dropped rather than truncated. Results below use checkpoint 150.
The prompting comparison uses DSPy’s BootstrapFewShotWithRandomSearch over the same hand-written prompt: seven candidate programs scored on 40 training dishes, with the winning program hashed before the validation set was loaded; the evaluation script refuses to run if the hash does not match.
Results on held-out val-200
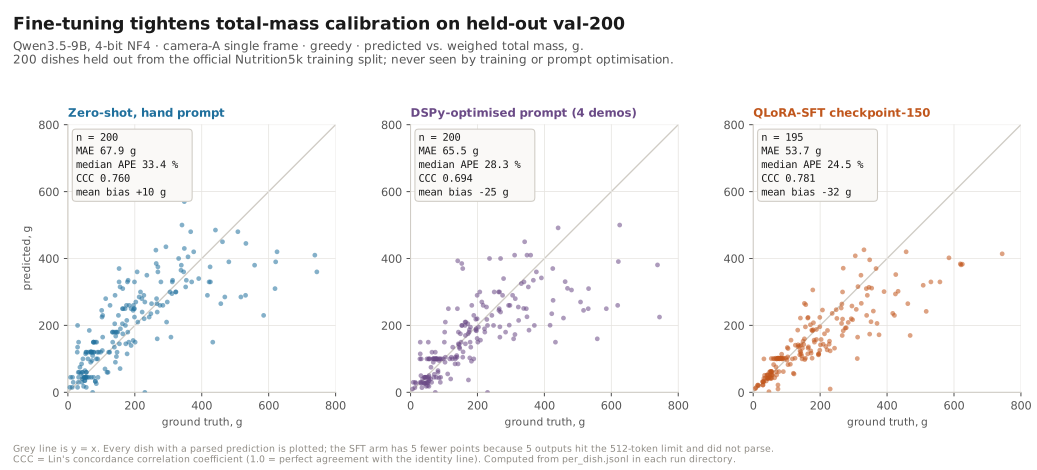
Same 200 dishes, same settings, three variants of the same base model:
| Metric | Zero-shot | DSPy-optimized | QLoRA-SFT |
|---|---|---|---|
| Total mass MAE (g) | 67.86 | 65.55 | 53.72 |
| Total mass median APE (%) | 33.4 | 28.3 | 24.5 |
| Calories MAE (kcal) | 97.44 | 94.99 | 84.53 |
| Protein MAE (g) | 8.19 | 7.99 | 6.07 |
| Carbs MAE (g) | 15.63 | 12.95 | 9.39 |
| Fat MAE (g) | 6.22 | 5.45 | 5.25 |
| Component F1 (micro) | 0.124 | 0.286 | 0.505 |
| GT mass fraction matched | 0.155 | 0.458 | 0.689 |
| Prompt tokens per dish | 452 | 2,427 | 452 |
Fine-tuning on 3,337 examples improved every metric. The largest change is in naming the components: the fraction of ground-truth mass matched to a correctly named prediction went from 16% to 69%.
Prompt tuning vs. weight tuning
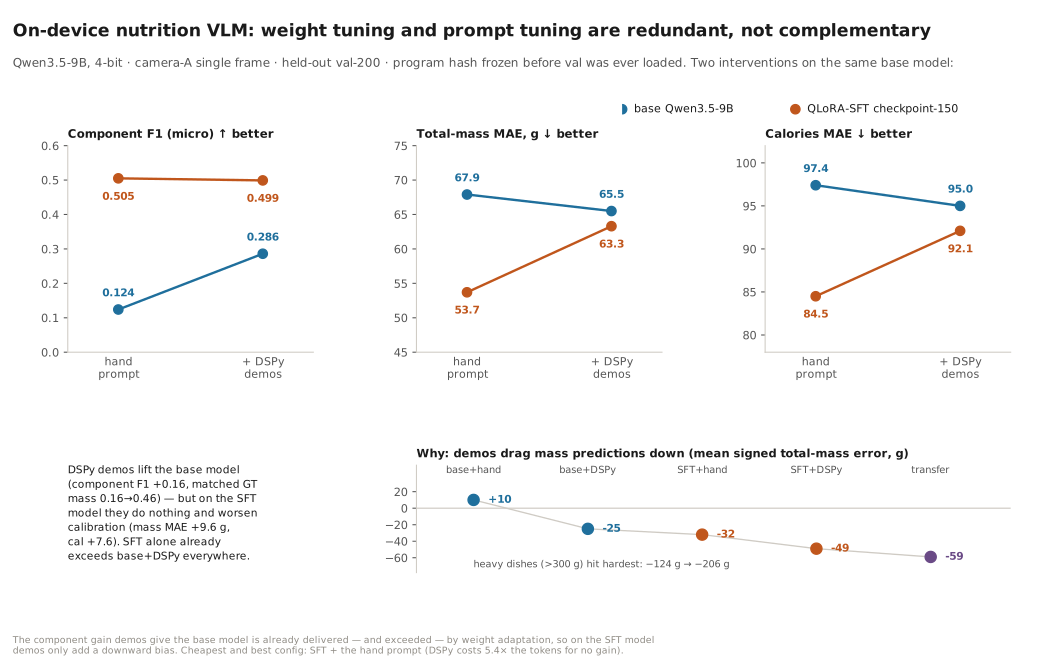
The follow-up ran the same DSPy optimization on top of the fine-tuned checkpoint, to see whether prompt demos add anything once the weights have been tuned. They do not add anything. On the base model, four few-shot demos raise component F1 from 0.12 to 0.29 and trim mass MAE by about 2 g. On the SFT model, component metrics are flat and every mass and nutrient error gets worse: mass MAE 53.7 → 63.3 g, calories MAE 84.5 → 92.1. The cause is a bias. Mean signed total-mass error goes from +10 g (base, hand prompt) to −49 g (SFT with demos). The demo dishes are mostly small, and a model already tuned to the dataset’s masses gets pulled toward them instead of learning from them. The demos also multiply the prompt to 2,427 tokens, 5.4× the hand prompt. The cheapest setup is also the best on every main metric: fine-tuned weights with the 452-token hand prompt.
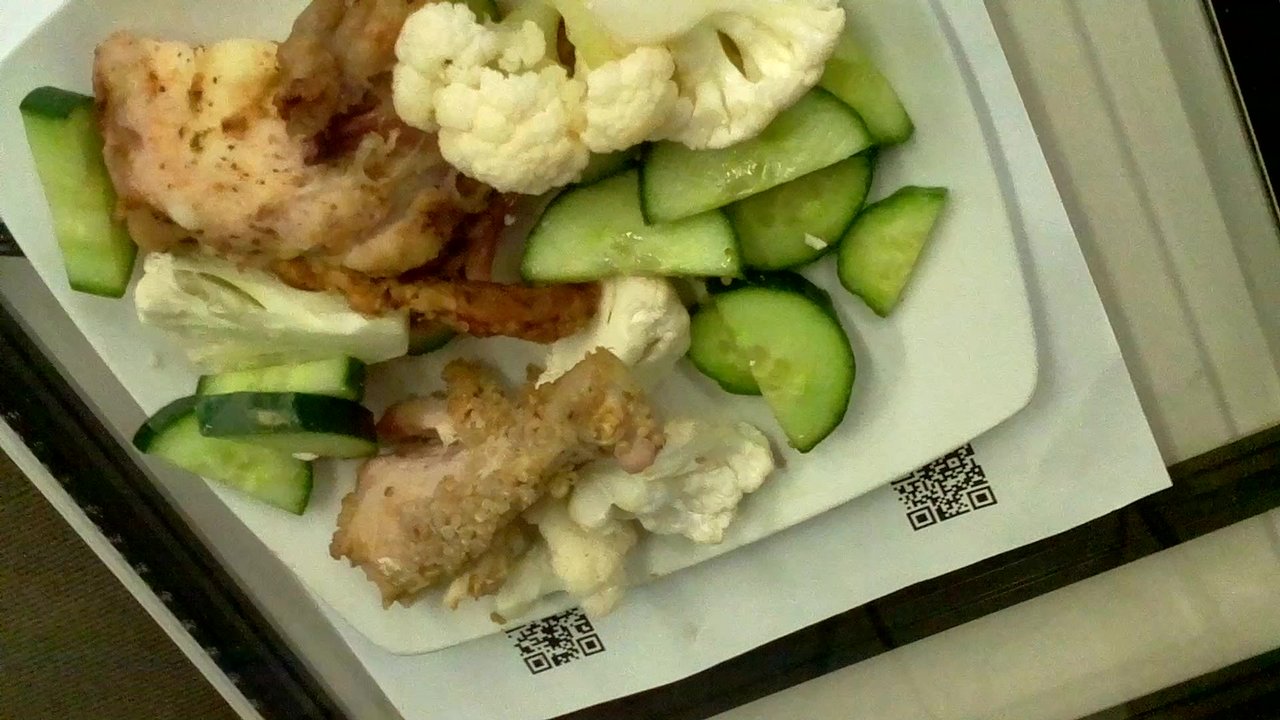
One example
| Ground truth | Zero-shot | QLoRA-SFT | |
|---|---|---|---|
| Components | cauliflower 89 g · cucumbers 85 g · chicken 151 g | chicken breast 120 g · cauliflower 80 g · cucumber 100 g | cauliflower 102 g · cucumbers 62 g · chicken 102 g |
| Total mass | 323 g | 300 g | 266 g |
| Calories | 280 kcal | 210 kcal | 205 kcal |
| Protein | 49.3 g | 26 g | 33 g |
I picked this dish because its fine-tuned mass error (17.6% APE) is near the val-200 median (24.5%), not because it is a good case. On this plate the zero-shot total mass is closer, while the fine-tuned model’s per-component masses and protein are closer. It shows what the outputs look like; it is not evidence for the table above.
Status
Active. The results above are on a validation split held out from the training data. The frozen official test cohorts have not been run yet, so there is no benchmark number yet. The plan is one scored run on n5k_rgb_test_4cam once the method is fixed, so the test cohort is used exactly once.